Home / Case Studies / 13-Week Cash Flow Forecast & Liquidity Model
CASE STUDY
Interactive13-Week Cash Flow Forecast & Liquidity Model
A rolling 13-week cash flow model that shows the lowest cash point, revolver need and borrowing-base headroom, week by week.
Example engagement – illustrative figures
Business challenge
A typical multi-site B2B distributor needs to see weekly liquidity, know when cash will dip below the minimum, and explain forecast accuracy to its lender.
Outcome
Management sees the low point of cash weeks in advance, sizes the facility with confidence and walks the lender through accuracy and headroom on one dashboard.
Overview
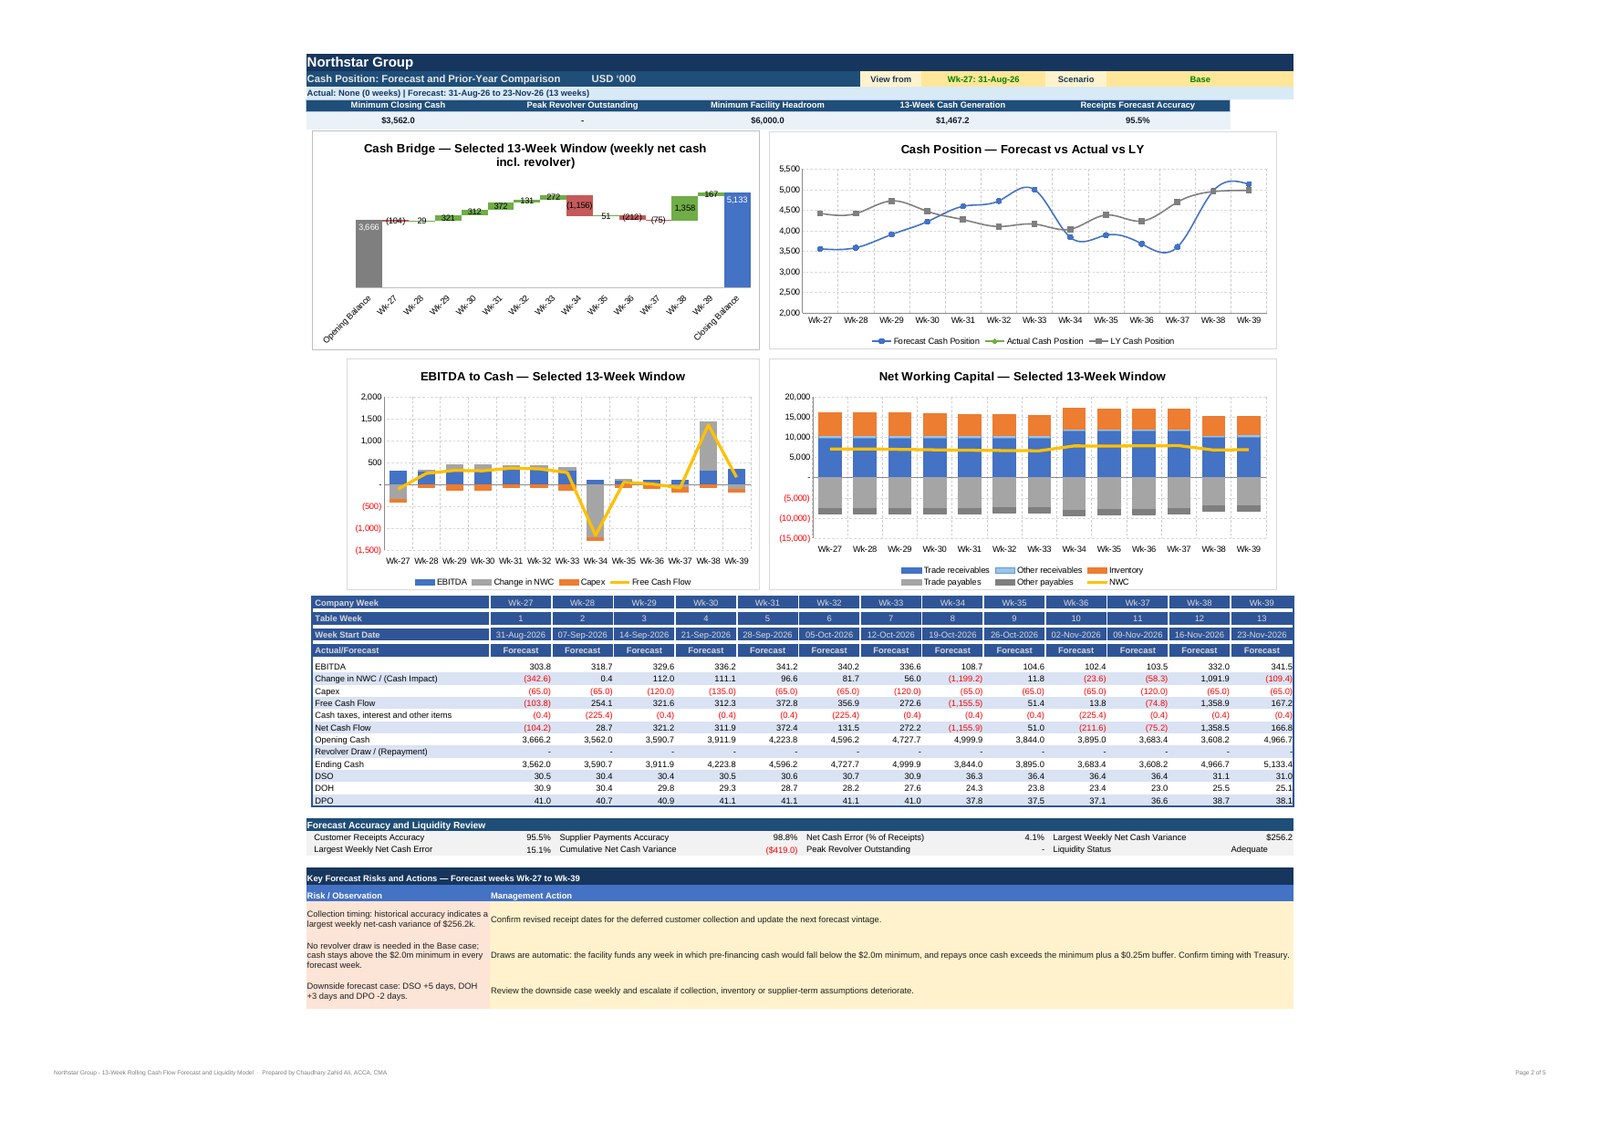
A rolling 13-week cash flow model that shows the lowest cash point, revolver need and borrowing-base headroom, week by week. Inside: cash bridge (opening to closing balance, weekly); forecast vs actual vs last year; EBITDA-to-cash reconciliation; working capital: DSO, DOH, DPO roll-forward; borrowing base and automatic revolver; three scenarios and a moving 13-week window. How to use this model: on the Dashboard sheet, use the drop-down in cell N2 to pick the scenario: Base, Downside or Upside. On the Dashboard sheet, use the drop-down in cell K2 to choose the 13-week window to view, from Wk-14 to Wk-27. On the TWCF, WC Roll Summary and EBITDA Reconciliation sheets, click the + / - buttons in the margin to open or close the grouped weeks and lines.
Approach
Weekly receipts and disbursements build to a 13-week cash flow, reconciled to EBITDA and working capital. A borrowing base limits the revolver, which draws and repays automatically in round steps. Actuals, forecast and last year sit side by side with a cash bridge and forecast-accuracy tracking.
Capabilities
Skills
LET'S WORK TOGETHER
Need something like this for your business?
Tell me what you are trying to solve. I’ll respond with a practical view of how I can help.