Home / Case Studies / CFO Financial Dashboard (Power BI)
CASE STUDY
InteractiveCFO Financial Dashboard (Power BI)
An eight-page Power BI report that puts P&L, balance sheet, cash, receivables and payables in one interactive view for the CFO.
Example engagement – illustrative figures
Business challenge
Finance leaders in a multi-country group typically need one current view of profitability, liquidity and collections across several countries, instead of separate monthly spreadsheets for the P&L, balance sheet, cash, receivables and payables.
Outcome
The CFO and board see in minutes which countries miss budget, where cash is tied up in overdue receivables or disputed payables, and what the cash position will be over the next seven months.
Overview
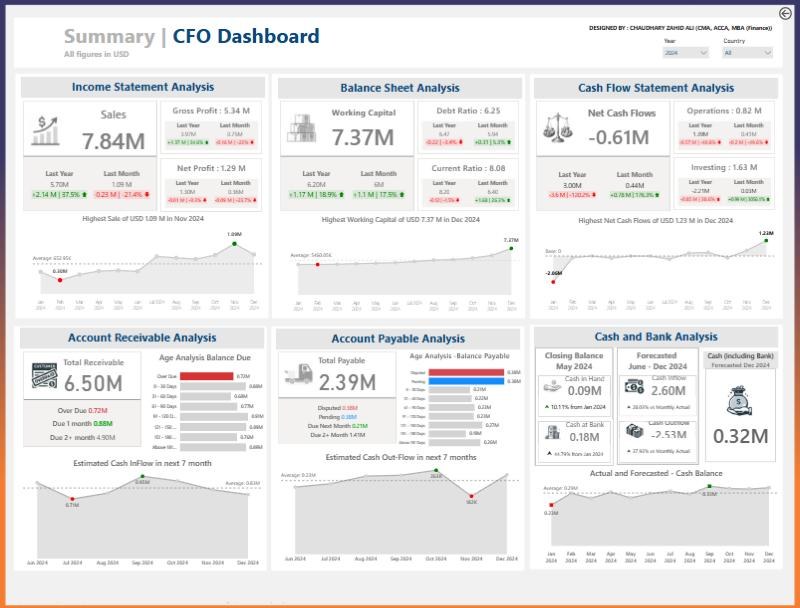
An interactive Power BI report for a multi-country business. A summary page shows sales, gross and net profit, working capital, debt and current ratios, net cash flow, receivables, payables and cash, each against last year and last month. Detail pages cover the income statement by country against budget, the balance sheet with ROCE and debt to equity, the cash flow statement by country, receivables and payables ageing, and a daily cash management view with a seven-month inflow and outflow forecast. How to use it: on the cover page, click a page button (CFO Dashboard, Income Statement, Balance Sheet and so on) to open that page. On the Summary page, use the Year and Country slicers at the top right to filter every visual. On the Accounts Receivable and Accounts Payable pages, filter by date range, customer or vendor, employee and ageing group. Hover over any chart or table row to see the exact figures; use the arrow at the top right to return to the cover.
Approach
A star-schema data model with a shared date table feeds DAX measures for actual, budget, last year and last month. Cards show each KPI with its variance; tables use data bars for budget gaps by country; ageing buckets, top-10 overdue lists and cumulative-versus-monthly charts explain the receivable and payable position, and a projected cash-flow trend shows the forecast cash balance.
Capabilities
Skills
LET'S WORK TOGETHER
Need something like this for your business?
Tell me what you are trying to solve. I’ll respond with a practical view of how I can help.