Home / Case Studies / Retail Management Accounts & KPI Dashboard (Power BI)
CASE STUDY
InteractiveRetail Management Accounts & KPI Dashboard (Power BI)
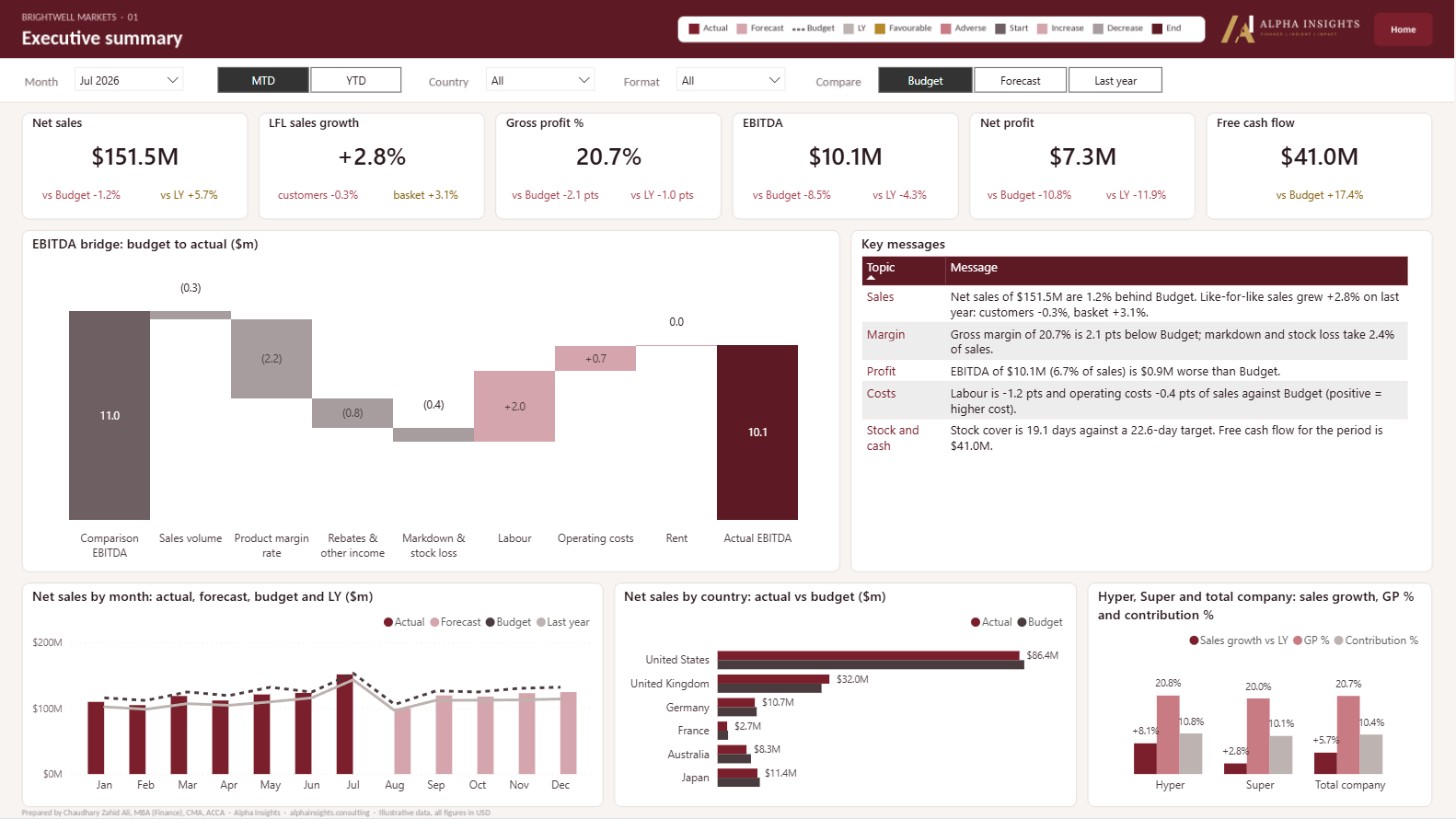
A 17-page Power BI pack for a 68-store retailer that ties sales, like-for-like growth, margin, stock, labour and cash back to budget, forecast and last year.
Example engagement – illustrative figures
Business challenge
A multi-country retailer running hypermarkets and supermarkets typically closes the month with a stack of separate files: a P&L by country, a sales report, stock and shrink reports, a labour file and a cash schedule. Each one tells part of the story, and finance spends the first week of the month reconciling them instead of explaining why sales, margin or cash moved.
Outcome
Management sees in one place whether the month beat budget, whether growth came from more customers or bigger baskets, where margin leaked through markdown and stock loss, which countries and stores are behind, and how the full year lands if trading carries on. Every KPI card shows the gap to budget and to last year in gold or red, so the problems stand out before anyone opens a table.
Overview
An interactive Power BI report for a 68-store food retailer trading in six countries (61 like-for-like stores, 5 new, 2 closed), at the July close. The cover shows the headline KPIs and links to 15 report pages: executive summary, P&L management accounts, consolidated P&L by country, sales and like-for-like, category and margin, marketing and promotions, margin leakage, store network, labour and operating cost, supply chain and availability, inventory, cash and balance sheet, full-year outlook with what-if levers, the full-year forecast P&L and a store profile. How to use it: on the cover, choose the month, MTD or YTD, and whether to compare against budget, the 6+6 forecast or last year; every page follows that choice. Click a tile to open a page, use the Country and Format slicers to drill down, and hover over any chart for the exact figures. Home at the top right takes you back to the cover.
Approach
A star-schema model built on the general ledger (actual, budget and 6+6 forecast) with store, country, account, cost centre and date dimensions, plus operational data for customers, stock, availability, supply chain, payables and capex. Around 1,900 DAX measures handle MTD and YTD, like-for-like store rules, the budget/forecast/last-year switch, the sales bridge split into customer count and basket size, the EBITDA bridge and the gold/red logic on every card. The what-if page lets you move volume, margin, wage inflation, rent and other levers and see full-year sales, EBITDA and free cash flow change straight away.
Capabilities
Skills
LET'S WORK TOGETHER
Need something like this for your business?
Tell me what you are trying to solve. I’ll respond with a practical view of how I can help.